
Where Utah Students Start: Enrollment Mix by Sector
Undergraduate headcount by sector shows where Utah students enter postsecondary education.
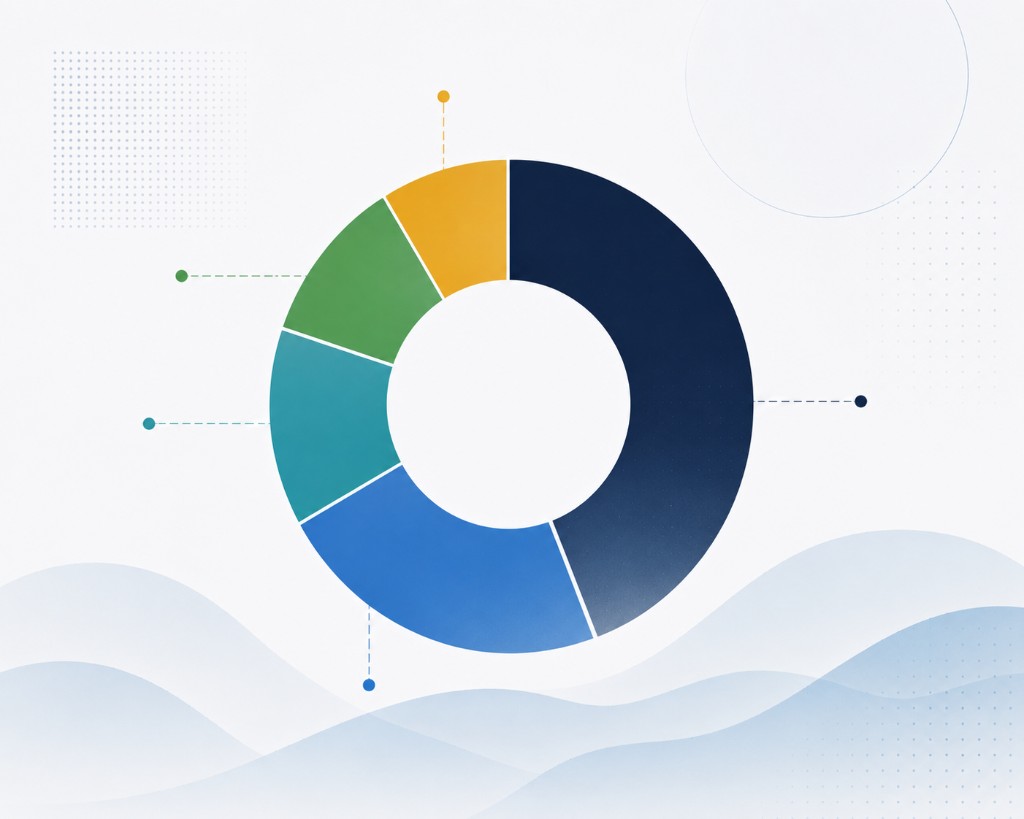
Private nonprofit institutions enroll 55.4% of reported Utah undergraduates while USHE four-year universities account for 31.0% — Western Governors University drives most private headcount. Headcount share does not predict completion or earnings.
Utah's enrollment landscape is concentrated: private nonprofit institutions enroll 55.4% of reported undergraduates while USHE four-year universities account for 31.0%. Western Governors University drives most private headcount, so sector share is not the same as local campus mix. Headcount share does not predict completion or earnings — those are separate chain links.
- Assumption
- Where most students enroll is where postsecondary opportunity concentrates.
- Question
- How is Utah undergraduate enrollment distributed across postsecondary sectors?
- Evidence
- College Scorecard UGDS · 63 Utah institutions · project registry sector flags
- Finding
- The evidence suggests a concentrated mix: private nonprofit 55.4%, USHE four-year 31.0%, USHE technical 3.6% — with outcome medians in Parts 3, 5, 7, and 8 measuring different stages.
- Limits
- Headcount totals, not completion or earnings; WGU concentration skews private nonprofit share.
- Does enrollment share predict outcomes?
- No. This part counts where students start (UGDS). Parts 3, 5, 7, and 8 report completion, earnings, net price, and debt — separate chain links.
- Why is private nonprofit enrollment so large?
- Western Governors University drives most private headcount. Sector share is not the same as local campus mix.
- Are USHE technical colleges small?
- They enroll 3.6% of reported undergraduates but issue credentials at high velocity (Part 2).
- Private nonprofit institutions enroll 55.4% of Utah undergraduates; USHE four-year universities account for 31.0%.
- USHE technical colleges enroll 12,827 students: a smaller share (3.6%) but high credential velocity in Part 2.
- Western Governors University accounts for most private-sector headcount; interpret sector shares with that concentration in mind.
The chart sums undergraduate enrollment1 by sector for Utah institutions, using the project's institution registry to classify USHE schools.
Enrollment (UGDS) shows where students enter the chain. Private nonprofit institutions account for 55.4% of reported Utah undergraduates; USHE four-year universities account for 31.0%.
Part 3 reports median six-year earnings for those pathway groups ($53K private nonprofit vs. $46K USHE four-year). Part 7 reports whether students finish (150% completion). Headcount share and outcome medians come from the same Scorecard extract but measure different stages.
Source: College Scorecard · total UGDS 355,292
Private nonprofit institutions enroll the largest undergraduate share; WGU is classified as private nonprofit; USHE totals exclude it.
- Private nonprofit enrollment (55.4%) exceeds USHE four-year share (31.0%) — but median earnings are $53K vs. $46K for USHE four-year.
- USHE technical colleges enroll only 3.6% of undergraduates yet report strong completion and earnings in Parts 2 and 7.
Key takeaway: Enrollment share answers where students start. Outcome medians in Parts 3, 5, 7, and 8 answer different questions — read both before inferring where opportunity concentrates.
Technical note: UGDS sums by sector using institution registry flags. WGU classified as private nonprofit.
What this means
Utah's enrollment mix is concentrated: private nonprofit 55.4%, USHE four-year 31.0%, USHE community college 6.1%, for-profit 3.9%, USHE technical 3.6%. Western Governors University drives most private headcount. Outcome medians in Parts 3, 5, 7, and 8 use the same institution registry but report completion, earnings, net price, and debt — not enrollment volume.
What this means for you
Find yourself below. Each bullet turns this report's evidence into a practical next step — not a prescription.
- Students Enrollment share does not predict whether you will finish or typical graduate pay — check schools on your list.
- Families Enrollment share answers where students start, not whether they finish or what they earn. Read Part 7 completion and Part 3 earnings before inferring opportunity from headcount alone.
- School counselors Private nonprofit enrollment is 55.4% but median earnings are $53K vs. $46K for USHE four-year — use both enrollment and outcome briefs in advising.
- Policymakers USHE technical colleges enroll a small share (3.6%) but report high credential velocity in Part 2; capacity planning should not rely on headcount alone.
- Part 7 — Whether students finish after enrolling: USHE technical median completion 79.0% vs community college 45.8%.
- Part 3 — Six-year earnings for the same sectors (private $53K vs USHE four-year $46K despite 55.4% vs 31.0% enrollment share).
- Part 5 — Family cost after grants at the institutions where these students enroll.
Sources & methodology
- College Scorecard UGDS
- utah-institutions.json sector flags
- USHE Data Home enrollment dashboards (cross-check)
Pathways & Outcomes original analysis; cite the report and link to the primary URL. Data vintage: College Scorecard Utah subset · see part sources.
APA: Pathways and Outcomes. (2026). Where Utah Students Start: Enrollment Mix by Sector. https://pathwaysandoutcomes.org/utah/research/utah-enrollment-by-sector/
Pathways & Outcomes uses AI tools to help draft reports and data briefs from verified public data and analysis. A human editor reviews every publication for accuracy, data consistency, clarity, methodology alignment, and discrepancies before release. AI does not determine what we investigate, what we publish, or what conclusions we reach. Editorial policy · About our team
Published June 10, 2026
Republish this brief
CC BY-NC-ND 4.0 · Attribution required